 Photo: Martin Rand")
 Photo: Martin Rand")
 Photo: Martin Rand")
Trend analysis of axiophyte recording in Hampshire
Distribution of species counts within tetrads
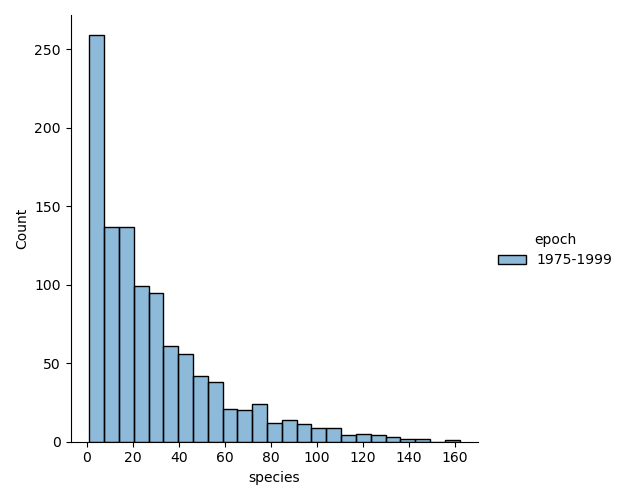
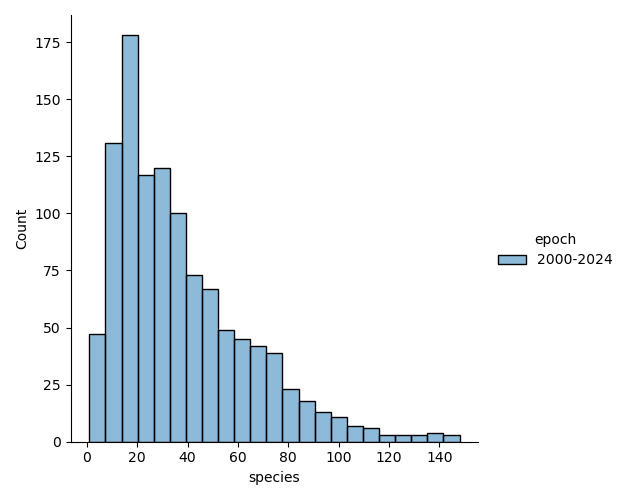
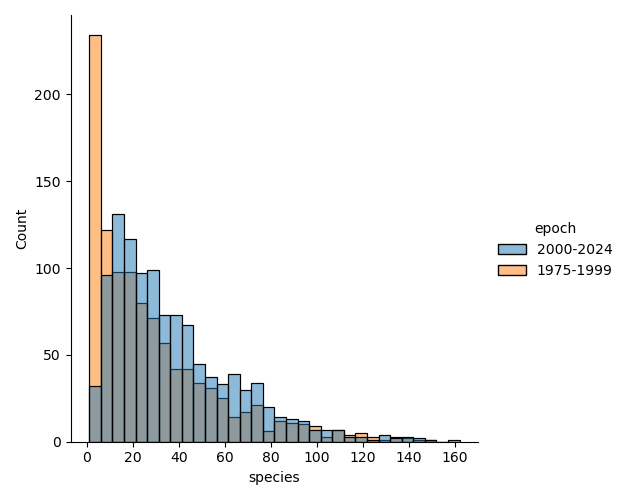
The most obvious factor revealed by the first two graphs is the effect of more intensified and comprehensive coverage in the years since Atlas 2000 recording. At the left-hand side of the graph, there are many fewer tetrads with very low counts, while much of the rest of the graph shows a small to significant increase in species recorded across almost all the range of species tallies. The overlaid graph makes this a little clearer.
Across the whole county, there is little to suggest a general decline in axiophyte distribution at this resolution.